
Size charts
How size charts work in the YourSizer merchant panel — audiences, categories, charts from images, tolerance settings and the comments shown under a recommendation.
Size charts are the part of setup that decides accuracy: a precise body model matched against a vague chart gives a vague answer. The Size Charts & Algorithm page keeps everything about them in one place.
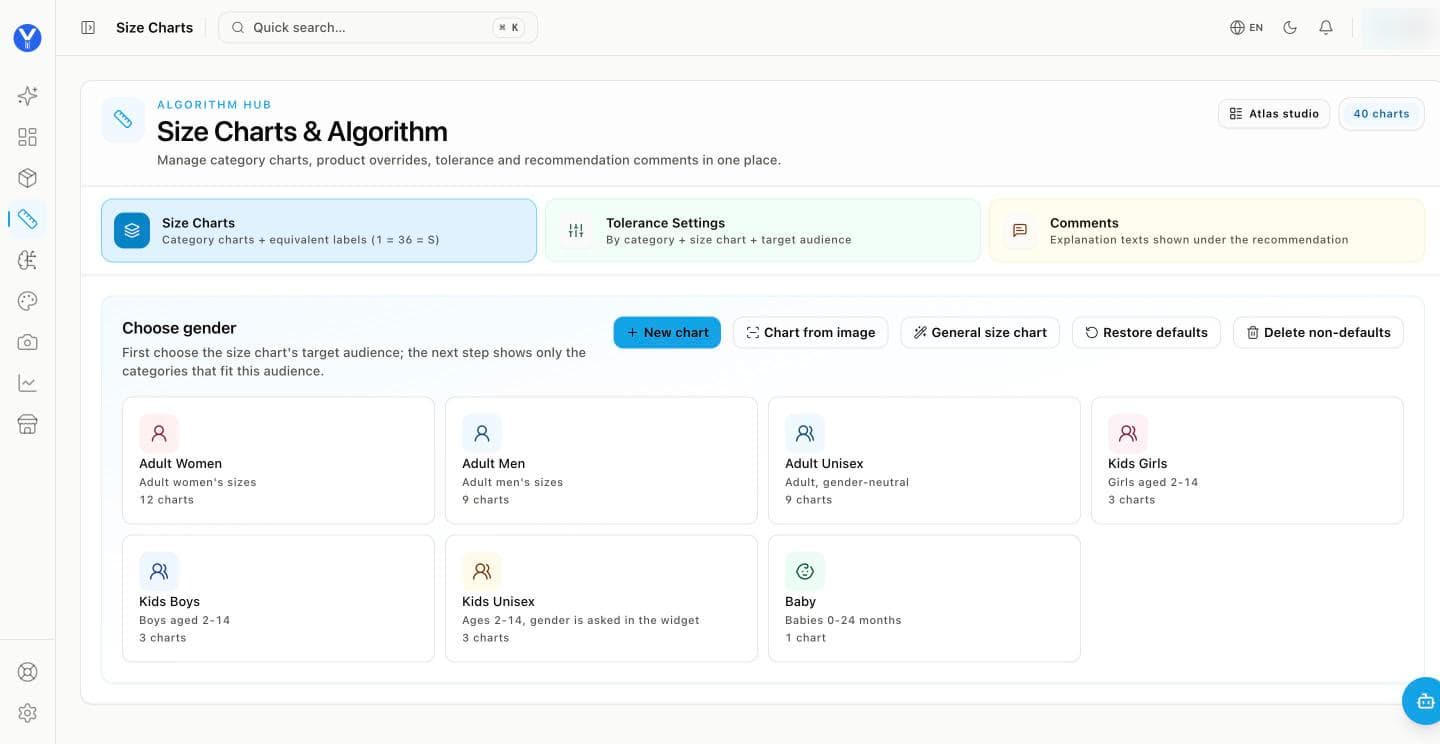
Three tabs
Size Charts
Category charts, plus equivalent labels so one size can be written several ways — 1 = 36 = S.
Tolerance Settings
How much room each garment has, set by category, size chart and audience. Fit style — slim, regular, relaxed, oversize — scales it.
Comments
The explanation shown under a recommendation, for example when a shopper sits between two sizes.
Audiences
Pick the audience before the category, and the panel shows only the categories that fit it.
| Audience | Who | Note |
|---|---|---|
| Adult Women | Women’s sizes | tops, bottoms, jeans, dresses, outerwear, bras, maternity, plus size … |
| Adult Men | Men’s sizes | |
| Adult Unisex | Adult, gender-neutral | |
| Kids Girls · Kids Boys | Ages 2–14 | European height grid with a growth-percentile anchor |
| Kids Unisex | Ages 2–14 | the widget asks for gender |
| Baby | 0–24 months |
Ways to add a chart
New chart — enter the measurement rows by hand.
Chart from image — upload a picture of your existing chart; it is read into structured rows for you to review instead of retyping.
Ready-made default charts come with every account; Restore defaults brings them back if you have changed them.
Which chart applies to a product
Product override first, then category, then brand, then the system default. Published charts are versioned and never edited in place, so a recommendation made last month can still be explained today. Products with a missing or implausible chart are flagged in the dashboard instead of silently falling back.